Today is World Migratory Bird Day 2019! A perfect moment to to have a look at the migration patterns of 105 different bird species or follow Swallows, Cuckoos or your favourite bird as they undertake their amazing journeys through Europe at the LIVE EBP viewer.
The EBP project has nicely featured today in MTV, one of the leading TV channels in Finland.
Our colleague Peter Uppstu, from BirdLife Suomi, has been talking about the project latests developments and the functionalities of the EBP viewer, but also about birds and birdwatching in general.
See the video and associated article in the MTV website here:
The 14th EBP meeting takes place at Évora, Potugal
The 14th EBP meeting took place in Évora, Portugal, on April 8th 2019. Unlike previous meetings, the reunion was quite short (one morning only) but benefited from the fact that many people were attending the Bird Numbers 2019 conference (which took place also in Évora and started the same day in the afternoon).
A total of 22 persons from 12 different countries attended the event this time.
The meeting took place at the wonderful senate room of Colégio do Espírito Santo, University of Évora
The state of the implementation of the automated data flow and the launch of the LIVE EBP viewer were two of the key points of the agenda. The progress made during the last months has been amazing and by the time of launching 15 online portals and more than 99% of the whole EBP data will be connected automatically on a daily basis.
The lessons learnt and considerations for future developments (e.g. addition of new species) were also discused. The option to compare LIVE maps with previous year data will be impleted most probably before summer.
An overview on the progress of the LIFE EBP project, which will be ending on April 15th, was also presented.
Another important point in the agenda was related to the future developments of the project and the options for funding.
In particular, the H2020 funding opportunities seemed to be particularly well suited for our initiative. One of the calls, "SC5-33-2020: Monitoring ecosystems through research, innovation and technology", is directed to proposals that shall design an EU-wide framework for monitoring biodiversity and ecosystem services and, therefore may be particularly interesting for us. However, such an application would require a very strong consortium and, most probably, involve more than a single EBCC project.
The options to collaborate with ENETWILD/EFSA were also discussed. In fact, a meeting with these organizations was going to take place on April 9th (also at Bird Numbers 2019) in order to explore a possible collaboration in the framework of the EFSA initiative to collate and analyze spatial and temporal distribution information on wild birds relevant to Avian Influenza in Europe.
Finally, it was stressed that the EBP should define which are the specific products that could realistically deliver in the short/mid term since this would be essential when seeking the proper funding/collaboration at the EU level.
The Russian colleagues gave a short talk about their online bird portal: ru-birds
Shortly after the general EBP meeting, on April 10th, eight persons participated in the fifth meeting of the LIFE EBP coordination team.
EURING and EBP have signed an agreement of collaboration
Today, in the framework of BirdNumbers2019, EURING and EBP have signed an agreement to promote co-operation in areas of common interest.
EURING co-ordinates bird ringing throughout Europe in order to study bird migration, movements and population dynamics at a European scale. Ringing and recovery data for birds ringed throughout Europe are collated in the EURING databank to support such research.
Through this agreement EURING and EBP agree to co-operate in order to study the migrations and movements of European Bird populations. This will be done primarily by seeking opportunities to undertake collaborative research, either through bilateral collaboration or through bilateral collaboration that also involves other parties.
EBP and EURING have already undertaken some exploratory work to examine how EBP data on year-round occurrence and EURING data on migratory movements can be combined to explore the migration routes of different populations and an account of this work has been published on the EBP website .
From left to right, Rob Robinson, EURING vice-chairman, Ruud Foppen, EBCC chairman, Gabriel Gargallo, EBP Steering Committee chairman, and Stephen Baillie, chairman of the EURING Migration Atlas Committee.
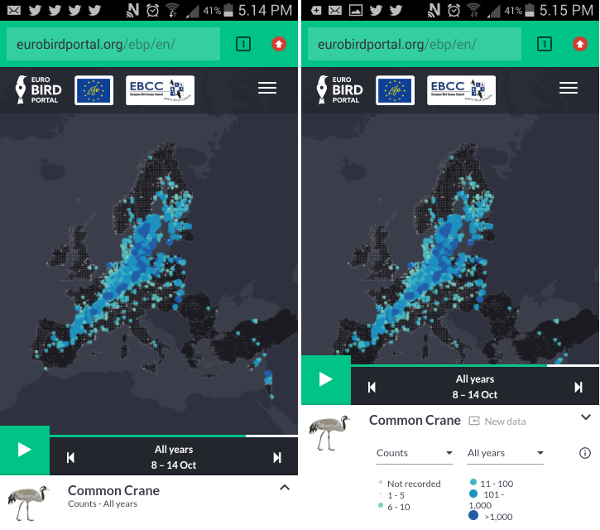
The LIVE EBP viewer has been launched this afternoon in the framework of the Bird Numbers 2019 conference in Évora, Portugal.
Now up-to-date bird movements that take place across Europe are just one click away! The LIVE EBP viewer shows the distribution of 105 bird species on weekly animated maps spanning from January 2010 up to the current week. This is an unprecedented development in European ornithology and a landmark in the mobilization of citizen science data.
The new EBP project video teaser presented in the launching event
In his opening speach Ruud Foppen, EBCC chairman, has described the origins of the EBP project and its role in the EBCC and Frank Vassen, from DG Nature, has hightlighted the relevance of combining the efforts of so many partners and online portals to obtain European-wide visualizations of bird movements.
Gabriel Gargallo, EBP project coordinator, has stressed the importance of the work developed by all the IT specialists involved in the data connectivity implementation, one of the key developments behind the LIVE EBP viewer. He has also stressed the the importance of the EU LIFE preparatory grant obtained shortly after the first EBP viewer was presented in June 2015. Thanks to this grant, during the last three years the EBP has put in place a completely new central database repository and automatic data-flow system, has increased by 27% its original geographic coverage and has significantly improved the quality of the data gathered across Europe.
The LIVE EBP viewer is possible thanks to the implementation of an automatic data flow that covers 99% of the whole EBP data
Bird Numbers 2019 attendands could enjoy the LIVE EBP viewer in the middle of the launching event
The new promotional video is ready for the LIVE EBP viewer launching!
The launch of the LIVE EBP viewer is approaching (April 9th) and nothing best that a new video teaser about the EBP to help the promotional campaign. Hope you like it!
The automated data flow implementation is finished
The creation of a new central database repository and the automated data flow were two key technological tasks that had to be undertaken due to the large quantity of data to be handled (the EBP online portals are collecting c. 45 millions new records every year) and the necessity of accessing these data in near real time.
The central database repository has three main functions: storing and administering the data, handling the data provisions from different local online systems (c. 20 different ones) and generating the content of the EBP viewer and other future EBP products. To automatically handle the data provisions from the local online portals an API web service was developed.
This API service provides a secure channel to submit the data, which is transferred using an predefined JSON schema. The API validates the JSON and basic data consistency and returns the required warnings to the sender. Also runs more detailed data checkings in the background.
Thanks to the work of the IT specialist of nearly 20 different online portals and the EBP IT team the data flow implementation has already been finished and with excelent results.
Currently, 15 online systems and the equivalent of 99.2% of the whole EBP data is submitted automatically to the EBP data repository on a daily basis using the EBP API service or using an hybrid approach that implies the use of the local system own API services to retrieve the data and the EBP API service to format and upload the data. Only three online systems (0.8% of the whole EBP data) are still submitting data manually.
This is a particularly important accomplishement and notably exceeds the initial LIFE EBP target: to connect automatically 12 online systems or at least the equivalent of more than 80% of all the whole EBP data.
To see all this complex system at full work, simply check the LIVE EBP viewer and enjoy watching even the latest bird movements!
The LIVE EBP viewer would have not been possible without the implementation of a new central database repository and an automated data flow system. Now the new central repository receives more than 99% of the whole EBP data automatically and on a daily basis (the equivalent to c 120,000 records every day, c. 45 million records by year). Then, also on a daily basis, the repository generates the tables used by the data visualization platform CARTO to render the different map visualizations in the EBP viewer.
Eleven online systems and the equivalent of 83.1% of the whole EBP data is submitted automatically using the EBP API service.
Four online systems and the equivalent of 16.1% of the whole EBP data are connected using an hybrid approach that implies the use of the local system own API services to retrieve the data and the EBP API service to format and upload the data.
Three online systems and the equivalent of 0.8% of the whole EBP data is submitted manually at least once every month.
Although PortugalAves eBird promotes the use of complete lists, with an annual average of 73% since 2010, the use of complete lists and coverage is unbalanced across the country – better coverage and use of complete lists in the coastal regions. With this is mind, and thanks to the support of the LIFE EBP Project, in 2017 a campaign was launched to promote participation in areas poorly surveyed and simultaneously the use of complete lists.
Number of complete and no complete lists (casual records) submitted annually on the PortugalAves eBird in Portugal since 2010 .
Thanks to this campaign, the number of complete lists has increased by 15% in Beja district (Southern Portugal) to 36% in Guarda district (Northern Portugal). Besides the increase on the number of complete lists submitted, there was also an increase in coverage, which in the end resulted in more and better data submitted to the EBP Project.
Number of complete and no complete lists (casual records) submitted annually on the PortugalAves eBird in Guarda district (Portugal) since 2010.
Number of complete and no complete lists (casual records) submitted annually on the PortugalAves eBird in Beja district (Portugal) since 2010 .
Ireland is one of the countries covered by the EBP project where data collection is still quite low. For this reason, and in the context of the LIFE EBP Action A10, BirdWatch Ireland undertook a communication campaign aimed at increasing the submission of bird observations to BirdTrack.
One of the actions involved the publication of one article about the BirdTrack portal and the EBP in the December 2018 edition of E-Wings, the monthly e-magazine circular of BirdWatch Ireland which is sent to 25,777 of its members and supporters. The article promoted the project and encouraged more volunteer uptake.
In spring 2019 another article that also promoted participation in BirdTrack was published in Wings Magazine, the BirdWatch Ireland quarterly membership magazine that is circulated to 15,000 members.
The BirdTrack article appearing in the 2019 spring issue of Wings Magazine
Moreover, during 2018 three presentations/guided walks were organized to promote Swifts and BirdTrack among different BirdWatch Ireland branches:
Kildare Branch (12th April 2018)
Meath Branch (29th May 2018)
Tolka Branch (21st November 2018)
Those attending were encouraged to use BirdTrack and, particularly, its mobile app.
The EBP features in the latest issue of the Natura2000 newsletter
The latest issue of the Natura2000 newsletter includes a double page article about the latest developments of the LIFE EBP project.
This newsletter, which is published twice a year, provides up to date information on activities, events and initiatives on the EU’s biodiversity policy and the implementation of the Habitats and Birds Directives.
The newsletter is free and is available in English, French, German, Spanish, Italian and Polish both in pdf format and in printed version.
The animated EBP maps available in the BirdLife Data Zone
We are happy to annouce that the animated EBP maps are already available in the BirdLife Data Zone, one of the biggest and most accessible sources of information about birds. The BirdLife Data Zone offers a large array of information on more than 10.000 bird species which focusses, particularly, on conservation and distributional aspects.
Now, the section "reference and further resources" of each of the accounts of the 105 EBP target species includes an embeded EBP map depicting their year-round overall patterns of distribution over Europe. The aim is to cover further species as soon as more of them are made available in the EBP viewer in the future.
This task has been conducted in the framework of LIFE EBP Action B2, which is devoted to promote synergies between the EBP and other signficant projects. In this case, the objective was to promote collaboration with BirdLife Data Zone in order to further enrich the content provided by this initiative and to bought to a broader audience valuable information collected by the online bird portals.
The EBP Fieldfare animated map embeded in the species BirdLife data Zone section
SmartBirds improves its website and app to promote the collecting of complete lists
The previous version of the SmartBirds Pro mobile app enabled data collection through the method of complete lists for a defined territory. Nevertheless, the majority of the users in Bulgaria were not familiar with the complete lists concept nor with its importance for more solid analyses of the data. To overcome this, during 2018 BSPB undertook the following actions:
Technical improvements in the data collection web portal www.smartbirds.org and functionalities of the mobile app SmartBirds Pro:
Improvement of the statistics preview for the collected biological information at the web portal www.smartbirds.org – better visualization so that every single user can see his/her list of species per area, time slot, trip etc. in his profile.
Integration of the statistics into the mobile app – the above options will be available on mobile app as well.
Adding of spatial search (selection) of geographical coordinates (or point selection directly from the map) and buffer around the selected point – all users can see lists of species in selected buffer/region (their own lists of observations or shared data of other users).
Build of “Heat map” representing the distribution of protected species based on the list of observations in the web portal.
Awareness campaign directed to promote the collection of complete lists among key user audiences:
Four presentations in front of the main mobile app users: researchers at the National History Museum of the Bulgarian Academy of Sciences, Institute of Biodiversity and Ecosystems Research, Universities, nature conservation NGOs and most active volunteers.
Promotion of the importance for collecting complete lists for a defined territory at the BSPB main web page and social media channels.
The LIVE EBP viewer to be launched on April 9th at Bird Numbers 2019
The LIVE version of the EBP viewer will be launched on April 9th in the framework of Bird Numbers 2019. This new version of the viewer will be showing the distribution of 105 bird species on weekly animated maps spanning from January 2010 up to the current week, hence the term LIVE.
The whole content of the LIVE viewer will be updated on a daily basis, thus ensuring that even the latest bird movements that take place across Europe can easily be seen on the maps. This has been possible thanks to the development of a new central database repository and the implemetation of an automatical data flow system involving, so far, 13 different online bird systems and c. 94% of the whole EBP data.
The LIVE EBP viewer will be an unprecedented development in European ornithology and the most important achievement of the LIFE EBP project.
The LIVE EBP viewer will be showing even the latest bird movements
How many birds are on the move? Towards quantitative species-specific migration models
In the context of LIFE EBP Action 12, in this post we describe another example of how EBP data and that from other external data sources (in this case radar observations) can be combined to better understand the nature of avian bird movements. In a previous post we dealt with the combination of EBP data and EURING bird recoveries.
EBP describes the geographical and seasonal occurrence of migratory species throughout Europe. But despite the incredible amount of information collected it remains difficult to estimate how many individual birds do actively migrate.
The European network of weather surveillance radar data (OPERA) offers a unique opportunity to estimate the number of migrating birds – day and night. Thanks to an interdisciplinary researcher network (ENRAM), it is nowadays possible to retrieve every ten minutes the avian migration intensity at up to 80 radar locations from 12 countries*. The data is automatically processed to extract density of birds aloft as well as the birds’ flight direction and speed. This continental network of weather radar surveillance provides quantitative information of avian migration at a continental scale and with high temporal resolution.
The above animation shows changes in migration intensity for three weeks during autumn migration in 2016 (from September 19th to October 9th, colour legend for low – medium – high density: blue – green - yellow, circles show locations of the weather surveillance radar). Highest intensity of bird migration is observed in central Germany and central France, with birds seemingly arriving from Poland rather than from Scandinavia.
Current work on developing probabilistic models for species-specific migration aims at integrating present information on radar migration intensity and EBP species occurrence, together with long term seasonal and geographical distribution of species. Thus combining data from EBP helps to define which bird species currently produce most of the echoes appearing on the radar screens. Such species-specific migration models open new opportunities to investigate the dynamics of avian migration and enable to predict events of mass migration. Information on mass migration events can alert for risks like the spread of avian disease, improve aviation safety and reduce mortality risks of birds with human made structures, e.g. windfarms or high buildings.
The above figure presents a general comparison between the Corrected Regional Occurrence (CRO) map of Song Thrush and Northern Wheatear (from EBP) and the average mean traffic rate (MTR) map computed based on data from weather radar.
Although at first glance, no obvious similarity appears, a careful analysis of these maps can reveal some interesting ties. The MTR maps show a strong migration during the week of October 1-7 in Western continental Europe. The same week appears to be a turning point in the departure of Northern Wheatear and the mass arrival in Song Thrush at this same location. In contrast, the bad weather of the week before results in a modest traffic rate according to weather radar. In comparison, the occurrence of both species remains similar compared to the previous week.
Despite the promising future for the aggregation of such complementary datasets, some challenges are still in the ways. Firstly, both methods are in their early stage and consequently their accuracy and uncertainty still need to be scrutinized. Secondly, the link between nocturnal active migration and diurnal observations by observers is not direct and a thorough understanding of their relationship is still required. Thirdly, the difference of temporal (and spatial) resolution and coverage between the two datasets requires some alignments. A day-by-day analysis of both datasets, which is now within reach, will provide deeper insights in timing and magnitude of mass migration over Europe.
The 13th EBP meeting brought very good news: the LIVE version of the EBP is nearly ready
The 13th EBP meeting took place in Brussels, Belgium, on November 29-30th 2018. A total of 19 persons from 10 different countries attended the event this time.
Attendants of the 13th EBP meeting at Mundo-B, Brussels, Belgium
As in previous meetings, the progress of the automated data flow implementation (LIFE EBP Action A6) was one of the key points of the agenda. During the last months the advances on that action have been very positive and it is expected that the automated data flow implementation will reach 86% of all data soon. A significant progress since the target of the LIFE EBP was to attain at least 80% of the whole data.
The other most relevant point in the agenda referred to the LIVE version of the EBP viewer, a development closely associated to that of the automated data flow. To optimize time and resources, the work on the viewer took place in parallel to that of the data flow and thanks to this approach it was possible to present its fully functional beta version during the meeting.
The LIVE viewer, though not still public, shows data up to the previous day and is updated on a daily basis thanks to the data received automatically through the data flow system that has been put in place.
The LIVE EBP viewer will be a significant milestone for European ornithology and, therefore, it was decided that Bird Numbers 2019, the 21st Conference of the EBCC taking place in Portugal in early April 2019, would be the ideal venue for its public launching. The exact timing will be decided in agreement with the Bird Numbers 2019 organizers in early 2019.
Since the LIFE EBP project is finishing by the end of the year, the state of progress of the overall project was also discussed in detail. Most of the actions, among them the most important ones, have already reached the expected results but in a few cases some intense work still will be required (e.g. Best Practice Guidelines, LIFE EBP Action A9).
At the end of the meeting, an open discussion about the potential outputs of the EBP project that could be of interest for the European Commission were also discussed.
The beta version of the LIVE EBP viewer was presented for the first time during this meeting
Just before the general EBP meeting, on November 29th in the morning, seven persons participated in the fourth meeting of the LIFE EBP coordination team.
The state of the data connectivity is being discussed during the LIFE EBP coordination meeting
Examining spatiotemporal patterns of bird movements using EBP observations and ringing recoveries
There are several sources of information on bird movements, including networks of weather radars , ringing data, and tracking data, that complement the information obtained from observational data gathered by EBP. Such information is particularly necessary if we are to obtain a good understanding of migratory connectivity and population-specific migration routes. LIFE EBP Action 12 started to explore how these different datasets can be combined to provide a more comprehensive picture of bird movements. This is an important approach for the development of the EBP project and has the potential to create powerful synergies among the existing research networks. Such analyses have the potential to provide crucial information for the conservation and management of migratory bird populations, which may be affected by environmental conditions at each of the different stages of their annual cycles.
In this post we explore possible ways in which data on marked individuals from the EURING Databank (EDB) and EBP observational data can be combined to describe the spatiotemporal nature of avian movement patterns. This may also provide useful ideas for the Eurasian African Bird Migration Atlas that is to be developed by EURING on behalf of CMS.
Here we use data on the Eurasian Curlew Numenius arquata and the Common Redstart Phoenicurus phoenicurus to exemplify how ringing data can highlight spatial connectivity patterns between different populations which cannot be detected from observational data alone.
The maps
To easily visualize how the information provided by each data source can complement each other, we prepared week by week animated maps at a 30x30 km square resolution combining EBP occurrence data and EURING databank recovery information.
The recovery of each individual bird was assigned to a “region of origin”, according to the area of Europe in which it was first encountered (Figure 1). Moreover, we added a three-week buffer to all ringing recovery encounters to overcome the sparseness of the ringing data compared to the EBP observational data. This means that an individual ringing recovery record is added to the map for both the week preceding and the week following the focal week, in addition to being mapped in the focal week itself.
Figure 1. Regions of origin as defined for the bird recoveries.
Results for Eurasian Curlew
EBP data shows that the Eurasian Curlew winters primarily along the coasts of the UK, France, Belgium, the Netherlands, Denmark, and Norway, with fewer observations along coastal Iberia and Italy (Figure 2). Spring migration shows birds moving into inland regions of the UK, central Europe, and northern Europe for the duration of the breeding season. In mid to late summer, Eurasian Curlew move out of inland and northern regions and observations become more concentrated in coastal areas by late September/early October. EBP data show substantial overlap in wintering, migration and breeding range, particularly in the UK and continental countries bordering the North Sea.
Figure 2. Eurasian Curlew weekly animated occurrence map based on EBP data.
Ringing data show that the majority of individuals originate from West, Central and Northern regions (Figure 3). Patterns are difficult to grasp in the animated map combining all recoveries (Figure 4) but those focussed on each of the three regions with the most data (western, central and northern regions of Europe) reveal some more interesting patterns that could not be discerned from the observational EBP data alone (Figures 5-7).
Figure 3. Locations of first encounter of Eurasian Curlew recoveries (the colour of the recoveries refers to their region of origin; cf. Figure 1).
Figure 4. Eurasian Curlew weekly animated map combining occurence EBP data (yellow dots) and EURING Databank recoveries (the colour of the recoveries refers to their region of origin; cf. Figure 1).
Ringing recovery data demonstrate that despite largely overlapping wintering, migration and breeding ranges, there is substantial migratory connectivity between particular Eurasian Curlew populations. Eurasian Curlew wintering in UK, France, Belgium and the Netherlands comprise both local breeders, but also birds which breed in Finland and Russia (Figure 5).
Figure 5. Eurasian Curlew weekly animated map combining occurence EBP data (yellow dots) and EURING Databank recoveries whose region of origin is western Europe (cf. Figure 1).
While Figure 5 shows movement between wintering Eurasian Curlew in the UK and France to northern Europe, the reverse can be seen in Figure 6. Eurasian Curlew first ringed in northern Europe, primarily originating in Finland as breeding birds, spend the winter in coastal area of the East Atlantic, primarily in the UK and France with some in Belgium and the Netherlands. Ringing data also clearly demonstrate that in July and August, Denmark is a staging site on autumn migration for birds originating from northern Europe.
Figure 6. Eurasian Curlew weekly animated map combining occurence EBP data (yellow dots) and EURING Databank recoveries whose region of origin is northen Europe (cf. Figure 1).
In contrast, Eurasian Curlew ringed in central Europe comprise multiple different populations (Figure 7). Birds originally ringed in central Europe appear to be either migrants or local breeders. Some winter in Eastern Atlantic coastal areas and breed in central Europe, primarily Germany. Other individuals are likely captured on their migration to breeding locations in Russia. Some Eurasian Curlew are captured in south-central Europe only in March, and are thus likely migrants wintering on the North African Mediterranean coast and breed either in central Europe or are captured on their migration to breeding sites in northern Europe.
Figure 7. Eurasian Curlew weekly animated map combining occurence EBP data (yellow dots) and EURING Databank recoveries whose region of origin is central Europe (cf. Figure 1).
Results for Common Redstart
EBP data show that Common Redstart are a typical Afro-Palearctic migrant, and do not start appearing in southern Europe until early March (Figure 8). By early April, birds have reached the UK, the Netherlands and northern Germany, and by late April and early May occur as far north as northern Scandinavia. Birds begin disappearing from northern Europe throughout July and August on autumn migration, and there are few records of Common Redstart anywhere in continental Europe after mid October.
Figure 8. Common Redstart weekly animated occurrence map based on EBP data.
The majority of individuals were ringed in West, Central and Northern regions (Figure 9). As with Eurasian Curlew patterns are difficult to grasp in the animated map combining all recoveries (Figure 10) but those focussed on each of the three regions with the most data (western, central, south-central and northern regions of Europe) reveal some more interesting patterns of movement that could not be discerned from the observational EBP data alone (Figures 11-14). We do not discuss migration through the eastern Mediterranean here, as there are too few EBP and ringing data from this region.
Figure 9. Locations of first encounter of Common Redstart recoveries (the colour of the recoveries refers to their region of origin; cf. Figure 1).
Figure 10. Common Redstart weekly animated map combining occurence EBP data (yellow dots) and EURING Databank recoveries (the colour of the recoveries refers to their region of origin; cf. Figure 1).
While the EBP data show Common Redstart migrating in spring and autumn through both Iberia and Italy, ringing recovery data demonstrate that these birds originate from different populations. Common Redstart first encountered in northwestern countries in Europe (UK, France, Belgium and the Netherlands) migrate almost exclusively through Iberia, with very few ringing recoveries in Italy on either northwards or southwards migration (Figure 11).
Figure 11. Common Redstart weekly animated map combining occurence EBP data (yellow dots) and EURING Databank recoveries whose region of origin is western Europe (cf. Figure 1).
In contrast, a few individuals first encountered in northern or central European countries migrate through Italy, though the majority from both regions appear to migrate through Iberia in both spring and autumn, and move on to return to breed in either northern or central Europe. A few individuals first encountered in central Europe were clearly migrants which breed in northern Europe (Figures 12-13).
Figure 12. Common Redstart weekly animated map combining occurence EBP data (yellow dots) and EURING Databank recoveries whose region of origin is northen Europe (cf. Figure 1).
Figure 13. Common Redstart weekly animated map combining occurence EBP data (yellow dots) and EURING Databank recoveries whose region of origin is central Europe (cf. Figure 1).
On the other hand, the majority of Common Redstart observed in Italy appear to be birds which both migrate through and breed in this region, though a few individuals encountered here do migrate to central or northern Europe (Figure 14).
Figure 14. Common Redstart weekly animated map combining occurence EBP data (yellow dots) and EURING Databank recoveries whose region of origin is south-central Europe (cf. Figure 1).
Future opportunities
Here we have adopted a very simple approach to explore how EBP data on year round variation in occurrence might be combined with data on marked birds to show the year round movement patterns of different populations. A more comprehensive analysis would need to take account of a number of additional variables including the time of year when birds were marked, spatial variation in recovery probabilities and the potential for differences in movement patterns between age and sex categories. Despite these limitations the results are encouraging, demonstrating clear differences in population-specific movement patterns that can be linked to overall variation in occurrence.
The Eurasian African Bird Migration Atlas will provide a first opportunity to develop some of these ideas further. In the medium term we look forward to large-scale quantitative models that will provide robust assessments of population-specific movement patterns by combining large-scale occurrence data of the type gathered by EBP with data on individual and population-specific movements from ringing, tracking and other data sources.
A contribution by: Samantha Franks & Stephen Baillie (BTO)
The automated data flow implementation to reach 75% of the whole EBP data soon
The implementation of the automated data flow has been advancing notably during the last weeks. Trektellen (data from Netherlands and Belgium) is already connected and the work with Avimap (Netherlands), DOFbasen (Denmark), Tiira (Finland) and Birds.cz (Czech Republic) is advancing well or even in test mode phase. Once all these systems are fully connected roughly 75% of all the data collected in the framework of the EBP partnership will already be being submitted automatically to the central repository.
For portals that will not be connected automatically in the course of the EBP LIFE project (mostly portals that joined once the LIFE project started), a manual or semiautomatic data flow system is being put in place to ensure that the real time version of the EBP viewer shows data from the whole partnership. On this regard, it is important to note that the data from Smartbirds (Bulgaria) has already been uploaded to the central data repository and that the work with the portals map.mme.hu (Hungary) and Ornitodata and OpenBirdMaps (Romania) is advancing very well.
The data from Trektellen (Netherland and Belgium) and Smartbirds (Bulgaria) is already depicted in the beta version of the new real-time EBP viewer
Three new species (Blue Tit, Winchat and Stonechat) have been added to the EBP viewer. These species were already among the 105 target EBP species but have remained hidden due to some technical problems with the data.
Due to their contrasting migratory patterns, the Winchat and the Stonechat are a nice pair to be seen in the EBP viewer
Data from Croatia has been added to the EBP viewer
The EBP viewer maps have been updated to show the data from Croatia. With this later addition, currently the EBP viewer is already showing information of all EU Member States except three (Lithuania, Malta and Slovenia).
Most of the data has been collected since 2015, when the local ornitho portal was launched, but there are some records from previous years. Currently, the portal is collecting more than 20,000 records a year.
12 countries already submitting data automatically to the central EBP data repository
The automated data flow implementation keeps advancing. Currently we are already receiving data in near real-time from 12 different countries and three online systems: BirdTrack, Ornitho and Aves Symfony. All them submit data automatically to the EBP central repository on a daily basis and updated up to the previous day.
The beta version of the real-time EBP viewer is also automatically updated and almost live visualizations of the latest bird movements can already be seen (see GIF shown below). This new version of the EBP viewer will be accessible to EBP partners in brief.
This August movements of species like the Yellow Wagtail and the European Honey Buzzard can easily be appreciated in the beta version of the new real-time EBP viewer.
At the start of the 24-hour challenge there were 122 birdwatchers (32 teams) that struggled with tiredness, insects and heat - all to see as many species of birds as possible.
All species detected were submitted to ornitho.pl portal or NaturaList app. The winner team recorded 165 species, which is probably the Poland record. 14 teams with 50 observers in total decided to collect data in complete lists. In total they submitted 91 lists with 187 bird species.
This year Poland is collecting 35% more complete lists than the previous one and 2,6 times more than in 2010. A great step foward in terms of data quality!
Distribution of records collected during the 10th Big Day in Poland in May 2018
Promotion of complete lists and participation in Spain: we keep growing!
So far, the data collected in Spain has shown to be insufficient for most of the species and large areas of the country. This can easily be seen in the EBP viewer maps, where gaps of information in some parts of Spain are still quite obvious. Gaps that a campaign undertaken with the help of LIFE EBP funds during 2017 intended to correct by means of increasing participation in areas previously poorly surveyed as well as promoting the collection of complete lists.
The campaign, undertaken by SEO/BirdLife, was focused on the dissemination of eBird Spain, already launched in 2015, among volunteers, partners of the organization and ornithologists in general. For this purpouse, the following activities were carried out:
Organize talks and courses.
Undertake dissemination activities in several key events (Bird Fairs and Bird Days).
Organize meetings with the reviewers and coordinators of eBird Spain to extend the network of reviewers and the dissemination of the system to more regions.
Organize meetings with the coordinators of the monitoring programs.
Put in place a monthly contest among participants who have submitted a minimum number of complete lists (binoculars were given as a prize).
As shown in the following graphs, the promotional campaign has been a success and the main key stats on participation and data quality (amount of complete lists) are increasing steadily.
Evolution of the number of complete lists collected in eBird Spain during 2014-2018 (2018 figure refers only to the first quarter)
Evolution
of the number of record collected in eBird Spain during 2014-2017
Evolution
of the number of people submitting data to eBird Spain during 2014-2018 (2018 figure refers only to the first quarter)
The second phase of implementation of the automatic data flow has started
To automate the data flow between the different local online portals and the central EBP database repository is one of the key tasks to be done in the framework of the LIFE EBP project.
A JSON schema and API solution has been developed to encode and transfer the data and already applied to connect two of the more widespread online systems within the EBP partnership (BirdTrack and Ornitho), which provide c.60% of all the project data.
Now, the second phase of the implementation of the automated data flow has started, aiming at connecting a further 10 online systems or, at least, the equivalent of more than 80% of all data collected by the EBP partnership.
At the local online system side, there are various tasks that have to be conducted:
1. Preparation work
Data aggregation (10x10 for casual data).
Unique id’s generation.
Create methods to handle updates and removals.
Map the species codes.
Map the breeding evidence codes.
2. Basic data provision testing
Implement Oaut2 client to access to the API.
Start with simple data provisions in Test Mode (T).
Determine protocol data and define protcols.
3. Standard data flow integration
Create Standard Mode (S) data provisions with real data.
Create cronjobs or equivalent to send data as periodic tasks.
Test removals and past modifications.
4. Data flow with standard
Send old data in Bulk Mode (B) in chunks. (optimal provision size should be determined).
Complete instructions, with a detailed API documentation and specifications as well as a specific website have been prepared to facilitate the work of the partners. Moreover a test submission mode has been developed so that partners can try the connectivity before submitting real data.
Meeting with the colleagues from ArtDatabanken regarding the automated connectivity between Artportalen and the EBP central database repository
A specific website have been prepared to facilitate the work of the partners
There were two main reasons behind the decision of developing a new version of the viewer. On one hand, the partnership increased largely, particularly in 2017, thanks to the participation of the key ornithological institutions in Bulgaria, Croatia, Cyprus, Estonia, Greece, Hungary, Romania and Turkey and their respective online portals. This meant that the geographical area shown in the previous version of the viewer was far too limited to properly show the data collected by the new partners. Moreover, the increase in geographical coverage would require also doubling the capacity of the current cloud mapping and database repository that handles the processed data used to visualise the animated viewer maps.
On the other hand, it was required to adapt the old version of the EBP viewer to the much higher updating frequency expected to be put in place by the end of 2018, when a new data sharing standard, automated data flow and database repository will be fully functional. Up to know, the data has been uploaded to the viewer once a year and the whole data flow has been managed on a manual or semiautomatic basis (the partner’s datasets are not directly connected with the central EBP data repository). By the end of the year, thanks to these new technical developments the content of the EBP viewer will have to be updated at a weekly basis and showing data up to the previous week.
Finally, this new version is fully responsive and tablet and mobile friendly, allowing people to enjoy the EBP maps from a much bigger array of devices than previously.
The new version of the EBP viewer can also be enjoyed from mobile devices
The EBP data flow is starting to work on near real-time
To be able to updated in near real-time the EBP viewer by the end of the year (a key objective of the LIFE EBP project), it is vital to automate the data flow between the different local online portals and the central EBP database repository. And this is the main objective of LIFE EBP project Action A6.
The task is advancing well and currently the BirdTrack and Ornitho online systems are already connected to the central EBP database repository. This is particularly important since these two systems collect c.60% of all the EBP data and the experience gained with them will be very useful for the next stages of development of this action.
Furthermore, we have developed a real-time test viewer (the basis of the future version of the EBP viewer) that is already working with the data submitted by BirdTrack and Ornitho in near real-time. The results are promising and we expect to put the beta version of this viewer available to the EBP partners during early summer.
The EBP real-time test viewer is already showing fresh data from BirdTrack and Ornitho
The occurrence map of Eurasian Golden Oriole as seen in the EBP real-time test viewer using ornitho data from this spring
The principal
online portal used by naturalists in Belgium is the multilingual www.waarnemingen.be/observation.be
(of the global www.observation.org
family). Since its launch in 2008, it generated 29 million records of over
20,000 species (the portal accommodates all taxa). Most records have
traditionally been casual observations, resulting in presence-only type
data. Making complete lists was possible online since 2012, but never became
popular.
Since 2016,
more than 50% of observations are registered using mobile phones (80% Android).
Hence, a smart and easy check-listing system was developed linked to track
recording in the app ObsMapp (for Android). With the support of the Life project EuroBirdPortal,
listing of at least all species (but whenever possible also all individuals)
was promoted from spring 2017 in various ways, but principally by repeatedly
raising awareness amongst observers of the value of check-list data and of the
ease to produce them in ObsMapp. There were some 20 announcements, e.g. as news
items on the website, in electronic newsletters, on social media and publications
in bird journals. The number of lists collected is now also shown as part of
the daily statistics on the home page. The promotion of complete lists became a
standard item in courses, talks at symposia and webinars. The top100 ranking
observers (responsible for 42% of all bird data) were contacted individually
with tailor made advise on how to improve their data by listing and track
recording. Making lists is also one of the criteria in the 10-year
waarnemingen.be anniversary competition (with daily personal stats shown on the
website).
The home page incorporates now also daily statistics on lists, tracks and
pointcounts (e.g. 6 May 2018)
This promotion
campaign doubled the flow of lists in a few weeks. The number of records
attached to lists increased from 3,2% in 2016 to 10.6% of all records in 2017. Listing
linked to track recording in ObsMapp quickly became the principle way of producing
lists (It is now also being built in iObs for iphone). The number of lists
shows a strong annual cycle, with almost 10 times more lists in spring and
early summer. That is mostly because this is a multithematic portal and listing
of e.g. butterflies, dragonflies or bees ceases in winter.
The promotion made listing linked to mobile track recording with ObsMapp
popular (more than one taxonomic group can be listed simultaneously)
Preliminary
analyses of bird lists demonstrate their usefulness. For example, outbreaks of Usutu
virus affected birds in parts of Belgium in summer 2016 and 2017 for the first
time. Blackbirds were particularly badly hit. Because there is no close link in
such abundant species between the number of observations and the number of
incidental records being reported to the portal, incidental observations cannot
be used directly to investigate the impact of Usutu, other than as an indication
from the higher number of dead or ill birds reported that there was a problem
and when it occurred (dotted lines in the figure). There were more dead or ill
birds reported in 2017 and they occurred a month earlier than in 2016.
Even though the number of lists is not all that large yet (and therefore graphs are not very stable), it already gives a much better indication of the impact of Usutu: during the first limited outbreak in only a small part of the country in 2016, the reporting rate of Blackbirds dropped by some 15% in August-September 2016. Reporting rates remained 10% lower throughout spring 2017, but crashed by more than half during a more severe and more widespread outbreak in July-August 2017. Reporting rates recover in autumn with the arrival of Scandinavian migrants, but in spring 2018 reporting rates drop again some 10% lower than in 2017.
Reporting rates of Blackbirds in complete lists in Belgium by week and the
number of birds reported dead or ill in 2016-2018 after outbreaks of Usutu
virus.
A contribution by: Marc Herremans, Kristijn Swinnen, Elke Leys and the observation.org programming
team.
The 12th EBP meeting and the third LIFE EBP coordination meeting took place in Portugal
The 12th EBP meeting took place in Évora, Portugal, on April 12-13th 2018. A total of 19 persons from 11 different countries attended the event this time.
The attendants of the 12th EBP meeting at the University of Évora, Portugal
The progress of the automated data flow implementation (LIFE EBP Action A6) was one of the key points of the agenda. The data flow implementation and data provision structure (JSON structure) was described in detail and the kind of work that has to be done at both ends of the data flow (i.e. the local portal and the central data repository) was also introduced.
After starting with the connectivity with BirdTrack and ornitho, now the second step of Action A6 (i.e. implementing the automatic data flow mechanism for around a further 10 online systems or, at least, the equivalent of more than 80% of all data collected by the EBP partnership) will start. Due to budget and time limitations, the priority now would be to connect those systems/partners already in the partnership when the LIFE project started (the main target of this Action) and those operating in more than one country.
The overal progress of the LIFE EBP project and the potential outputs of the project that could be of interest for the European Commission were other important issues discussed in the meeting.
The Senate room at the University of Évora, a fantastic location for the EBP meeting
Just before the general EBP meeting, on April 12th in the morning, 9 persons participated in the third meeting of the LIFE EBP coordination team.
The attendants of the third LIFE EBP coordination meeting
Observers
were particularly encouraged
to collect complete lists, explaining the relevance of this kind of data and
hightlighting that, thanks to the improvements in the Davas dati app, now
submitting complete lists was easier than ever.
See,
for example the articles that appeared in Dabasdati.lv on October 2017 and the detailed information provided also here.
Encouragement
to use the option of complete lists was also published in the magazine of the
Latvian Ornithological Society (LOS) “Putni dabā” and in the methodology of the EBBA project in Latvia.
Moreover, the importance of submiting this complete lists was also presented to
the participants of the annual meeting of LOS members.
There
were 2,027 full lists reported during 2017 (287 using mobile application and
1,740 through the web), containing 48,555 observations (8,267 as mobile uploads
and 40,288 through the web).
It is
planned to publish a new appeal in Dabasdati.lv in a few weeks to further remind
about the importance of collecting complete lists.
Dabas dati improves by allowing the reporting of complete lists through its mobile app
With
the help of the LIFE EBP project, the Latvian online portal Dabas dati will be
collecting more complete lists. This has been possible thanks to a series of
improvements in its mobile app that makes reporting of complete lists easier and thus more attractive
to the observers.
Now, to
activate the recording of a complete lists in the Dabas Dati app all is needed
is to press a button (Saraksta veidošana).
A green
indicator appears showing that all observations will be added to the list. At the end of the
observational event, the user selects the “Stop” button to end the list. Observations
are syncronized with the online portal as soon as the list is finished.
It is
also possible to add a name to the list to make finding of relevant
observations in the web easier.
The
start and end time are filled in automatically. Moreover, the user can indicate
whether all individuals were counted or not. It is possible to edit
observations while the list is active.
Some
other improvements were also made, including adding the possibility to switch
the background map to orthophoto and making the location of the buttons more user
friendly.
The new version of the EBP viewer is already online!
Today we are pleased to release an improved version of our viewer: now bird movements across Europe can be visualized in a way never seen before.
This new version of the viewer has also been updated with 40 million more new bird records collected in 2016 and now shows animated all-year round maps of 105 bird species for a period of seven years, ensuring that the EBP maintains its position as the largest and most dynamic citizen science biodiversity data flow in Europe.
This improved version of the viewer also incorporates a new visual design and several new functionalities, including zooming and embedding options (see an exemple just below these lines). Moreover, the extension of the area covered by the maps has increased markedly thanks to the incorporation of data from Bulgaria, Cyprus, Estonia, Greece, Hungary, Israel, Romania and Turkey.
All these improvements have been possible thanks to a LIFE preparatory project (LIFE15 PRE/ES/000002 / 2016-2018) granted in 2016 by the European Commission.
We hope that the new improved version of the EBP viewer will help highlight the value of the data collected through the online bird portals operating in Europe and the relevance of sharing bird observations. The EBP main objective is to unravel the seasonal large-scale patterns of bird distribution in Europe, but this can only be possible thanks to the contribution of 100,000 volunteer birdwatchers that share their observations in the online portals and by the efforts of EBP partners to combine this huge amount of data in a sound and structured way.
Thanks to these combined efforts we are in a better position to understand changes in bird migration patterns, like the new route followed by Cranes in Southern Europe, or the influence of weather and climate on bird migration.
30 participants from 16 different countries attended the 11th EBP meeting in Barcelona
The 11th EBP meeting took place in Barcelona on November 13-14th 2017. This has been the meeting with the highest participation so far, with 30 persons from 16 different countries having attended.
The attendants of the meeting in front of the Museu Blau, Barcelona
The main topics
discussed in the meeting included the new version of the EBP viewer, the estate
of the Best Practices Guide, the progress of the LIFE EBP project and the role
of the SMOG (Spatial Modelling Group of the EBCC) in the EBP modelling approach.
Moreover,
the first elections to the chair of the EBP Steering Committee and the
Executive Committee took place. The elected members were:
Chair EBP
Steering Committee: Gabriel Gargallo.
Members EBP
Executive Committee: Stephen Bailie, Ruud Foppen, Carlos Godhino, Károly Nagy, Jean-Yves Paquet, Hans Schmid and Peter Uppstu.
Some
figures presented in the meeting highlighted the good progress of the project
in terms of data quality. Complete lists have increased by c. 25% annually
since 2010 and countries such as France doubled the number of lists from 2015 to
2016!
A workshop with modelling experts took place in Barcelona in October
The current EBP modelling approach is being re-evaluated taking into account the new data standard and the future updating periodicity of the EBP viewer. For this purpouse, a workshop with modelling experts from the SMOG, the Spatial Modelling Group of the EBCC, was organized in Barcelona on October 27th 2017.
The main objective of the workshop was to better plan and coordinate the subsequent work to produce the new model maps and automated scripts. The discussions were very fruitful and the first trials using EBP data will be conducted in the next few weeks.
The maps of the new EBP viewer have been redesigned to properly show the whole area covered by the project
During 2017 quite a few new institutions have joined the EBP initiative, allowing a large increase in the area covered by the project, particularly towards the east and southeast. To be able to properly show these new areas in the EBP viewer, a complete redesingn of its maps has taken place during the last months. The results will be shown to the public in late 2017, once the data from 2016 is uploaded and the new version of the EBP viewer is launched.
The new EBP viewer has been redesigned to properly show the new areas covered by the project (countries shown in yellow).
The database repository infrastructure design is being tested
A first design of the EBP central database repository infrastructure has been produced and some tests are being conducted using Amazon Web Services (AWS). In parallel, the work to design the protocol that will be used to encode and implement the automatic data flow from the local portals to the central database repository has also started.
All this work is part of Action A4, aimed at designing a solid, long-lasting and cost-effective database repository and data flow system, and one of the key tasks to be developed by the LIFE EBP project.
Corrected Regional Occurrence (CRO) maps have been updated with the data from 2015 and the 50 new species and are already available in the EBP viewer.
Modelling the spatial and temporal dynamics of bird distributions is one of the main but challenging objectives of the EBP project. This work is underway and, therefore, it has to be stressed that CRO maps are still very preliminary.
Action A7, which is aimed at increasing the geographical coverage of the EBP, particularly, by adding countries situated on the eastern migratory flyways, is advancing very well.
During the last months most of this Action target countries have already joined the project. Namely, Bulgaria, Croatia, Estonia, Greece, Hungary and Romania.
Note, however, that the data provided by these new partners will only be shown in the EBP viewer in late summer, once the viewer is updated with the data for the period 2010-2016 and the maps redesigned to properly show the new geographic coverage.
The new EBP partners (countries in green) will greatly improve the geographic coverage of the EBP project.
The workshop on Best Practices took place in Namur, Belgium
EBP partners and guests gathered in Namur (Belgium) on 2-3 March 2017. Jointly with a regular EBP meeting, a thematic workshop was organized in relation to the Life EBP project action A9, aiming at “Promoting Best Practices and implementing overall benchmarks and quality indicators”. A total of 27 representatives from 17 countries attended the event, organized by Natagora, the local EBP partner. It was a great opportunity to improve the quality of the data collected and promote the continuous improvement of the individual online portals themselves.
The meeting attendants at Mundo-n, Namur, Belgium.
New update of the EBP viewer increases to 20.6 million the number of map combinations available to choose from!
Today, the EBP demo viewer has been updated with nearly 50 millions of new data. Moreover, the number of bird species available in the portal has been doubled and the period of years extended to 2010-2015. This is a first visible output of the Life EBP project.
Currently, the EBP demo viewer depicts animated weekly distribution maps of 100 different bird species for six years (2010-2015). Moreover, a new type of map has been added, allowing the visualization of the overall seasonal patterns of bird distribution by combining the whole six years of available data. Since two animated maps of any species, year and type can be selected to be shown simultaneously for direct comparison, this means that after the new update more than 20.6 million different map combinations are now available to choose from! Ten times more than before.
Snapshot of the EBP viewer: two distribution maps combining all available years of data (2010-2015) for the Brambling and the Tree Pipit, two of the new species available after the new update.
The number of records collected by the on-line bird recording portals run by the EBP project partners reached a new record in 2015: 40 million! This means 19% more records than in 2014, and 140% more than in 2010. During the last 5 years, the recording activity has been increasing permanently, a pattern easily seen in the animated heat map shown below.
The new EBP data sharing standard has been finished
The new data standard has been designed in order to notably improve the opportunities for data analysis and modelling in the framework of the EBP.
The work on the new standard has been lead by SOVON following the main guidelines agreed at the specific workshop
held in the Netherlands during the 8th EBP meeting.
The new standard and the main differences with the previous one are detailed in (this document).
Note, however, that the final technical documentation will only be available once the definition of the data flow standard and database repository infrastructure
is completed (see Action A4).
The complete list module is already implemented in the ornitho app (NaturaList)
The Ornitho app has been improved with a set of new functionalities that allow recording complete lists in a simple and effective way. The Ornitho system operates in eight European countries and collects c. 50% of the data that is currently submitted to the EBP project, therefore, with this new version of the app we expect that the number of complete lists and, therefore, the overall quality of the data collected by the EBP partnership will increase significantly in the forthcoming years.
The list of 50 additional species has already been selected
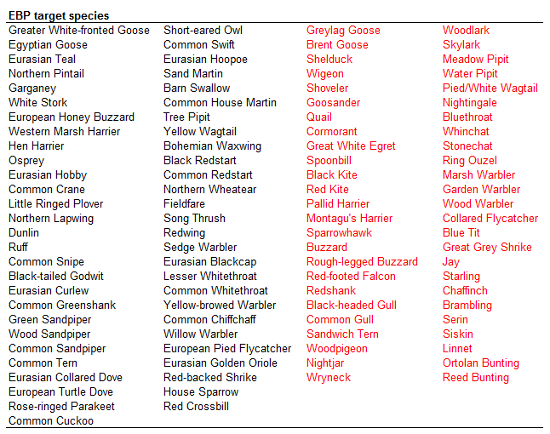
The last EBP meeting was very fruitful and great advances took place in such important issues as the definition of the new EBP data standard or the selection of the 50 additional target species. Now the number of EBP target species increases to 105 (the initial 55 species already available in 2015 and the 50 additional ones).
The new list of EBP target species (the new 50 ones shown in red).
The meeting attendants in front of Villa Wylerberg.
More than 2.6 million different animated map combinations available after the 2014 update
The data from 2014 has been uploaded to the EBP demo viewer, notably increasing the number of distributional maps that are depicted. With this update, now the viewer allows free access to animated weekly distributional maps of a total of 50 different bird species for five years (2010-2014). With several map types available, this means that more than 2.6 million different animated map combinations are available to choose from.
Millions of animated map combinations like this are available in the EBP viewer.
The LIFE agreement among the beneficiaries has been signed
The LIFE agreement among the beneficiaries was signed on March 23rd.
Since the coordinating beneficiary and the associated beneficiaries are jointly responsible for carrying out the LIFE Preparatoty project and complying with the relevant legal obligations, the European Commission requires that the coordinating beneficiary shall conclude a LIFE partnership agreeement with all the associated beneficiaries.
The new EBP data sharing standard will be one of the key points to be discussed in the next EBP meeting
The next EBP meeting will be held in the Netherlands during May 31th and June 1st. The meeting will be organized by (SOVON) and will take place at the Villa Wylerberg, Beek-Ubbergen.
The main guidelines for developing the new data sharing standard will be agreed at this meeting with the help of all EBP partners.
The LIFE EBP kickoff meeting took place in Barcelona on March 1st-2nd 2016.
The meeting was attended by the coordinating and associated beneficiaries (CTFC, BTO, SOI, ICO, NATAGORA, SOVON) and the Commission LIFE technical monitoring team. The meeting was very useful to clarify some key administrative and financial aspects with the Commission, to review the project actions and to plan the work for the forthcoming months.
Our colleague Nicolas Titeux has been appointed LIFE EBP project coordinator. He has already been involved in the EBP initiative helping, for example, with reasearch-oriented issues such as the perspective paper and the modelling approach, and has a good experience dealing with big EU-funded projects (e.g. the EUBON project ).
Nicolas will be based at the Forest Sciences Centre of Catalonia (the Coordinating Beneficiary institution) and work closely with Gabriel Gargallo, the EBP project coordinator.
Nicolas Titeux, in the middle, at the EBP meeting held in Brussels in 2015.
A grant to develop the EBP viewer into a near real-time solution
The EBP has recently secured a LIFE preparatiory grant from the European Commission to develop the project entitled “Combining and improving online bird portals data to display near-real-time spatiotemporal patterns of bird distribution across Europe", known by the acronym LIFE Euro Bird Portal (LIFE15 PRE/ES/000002).
The project has a duration of three years (January 2016 to December 2018) and an overall cost of 510.557 €, of which 60% (306.334 €) are financed by the European Union.
The main specific objectives of project are:
1) To create a new EBP data sharing standard, database repository and data-flow system capable of managing automatically and in near-real-time all data interchange processes between the local online portals and the central databank.
2) Adapt and improve the current EBP demo viewer and the spatial bird distribution models in order to reliably display detailed and up-to-date European-wide spatiotemporal patterns of bird distribution in near-real-time.
3) Increase the geographical coverage of the EBP project to include most of the European Union (>90% of its territory).
4) Improve the quality and relevance of the data collected.


 .
.